

At the time of this writing, it’s early October 2020. Now that we have been living in a Covid-19 world for 6 months, let’s reflect on our ppc trends since the shutdown happened back in March. We will examine the most important metrics that we use to measure our campaigns. We will look at our Google Ads trends and will make some predictions about what we expect to happen in the future.
Search Volume & Pre-Covid Stats
Are sellers still searching for our services? The answer is a resounding YES. And this is great news for our industry. The chart shows the search volume trend for 3 of the most popular motivated seller keywords (we buy houses, sell house fast, and cash for houses). You can see in this chart that for all 3 of these keywords, the volume is trending upward! This means that there are more people searching for our services now than ever before! We will dive into why this may or may not mean an immediate benefit to investors.

Let’s look at our Google Ads search campaigns in March through September and the trends of the most important metrics of them.
For context, in Dec 2019 – Feb 2020 our total stats across all active search campaigns were:
Conv Rate: 10.08%
CTR:2.74%
Avg CPC: $22.87
Cost Per Lead: $226.50
CTR & Conversion Rates
First, let’s start out by examining the Click-through rates (CTR) and Conversion Rates from the beginning of the govt shutdown in March, through the end of Sept. We will break it down into 3 charts for you with different data points in each.

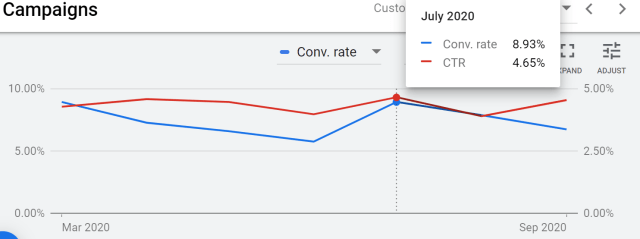


CTR hovered between 4.5% and 4.65%. Not very much variation at all. We believe this means that the messaging that used to work for homeowners is still resonating and there is still value for our services in the market!
Conversation rate had more fluctuation and peaked in July, which is not surprising. Summer is typically the hottest time of the year for leads! We will monitor to see if the decrease in conversion from September continues or if it’s just natural fluctuation. Conversion rate has not recovered to pre-Covid levels. We suspect it may be to the regulations that have bene put in place making it harder to evict tenants. It may also be that homeowners are in a holding pattern until there is more certainty about what the long-term situation with Covid will be in 2021 (not to mention the election).
From our sample size, we do not see any significant positive or negative changes due to Covid. We have heard anecdotally that many investors are thriving in real estate right now or have been put out of business completely. Covid may be causing more of a polarization in our industry, where the well run businesses are capitalizing more while those that were struggling died off. But, we can not prove or disprove this speculation with the data we have available.
Avg CPC & Cost Per Lead
Let’s now examine the Avg Cost-Per-Click (CPC) and Cost Per Lead (CPL). At the end of the day, CPL is what drives return and is what investors care about most!


Since April, we have seen a steady increase in the Avg CPC. It’s still below Dec 2019 levels, but only slightly. This most likely means one of two things.
First, there could be more competition entering the market. Business owners are getting their bearings after the initial shock of the shutdown and giving it another go (or being propped up by stimulus money).
Second, the value of a lead is increasing and investors are willing to pay more. The value of a lead increases when investors start to profit more per deal.
As real estate prices nationwide continue to increase, I would speculate that the ladder is more likely, but we cannot know for sure.
As for the Cost Per Lead, it steadily decreased from the beginning of Covid throughout the summer. But in September it went up to higher than pre-covid levels. Again, this could be natural fluctuation and we will monitor it. The conversion rate heavily affects cost per lead. A drop in conversion rate in Sept as led to this increase, and only time will tell if the trend continues throughout the fall.
A Word On Statistics And Variation
The data we are pulling is highly speculative. Being a small agency, we do not have a large enough sample size to statistically make any conclusions. If we add on a 1 new client in a very expensive market or have 1 account with irregular stats, it will throw the data off. We have significantly more clients in Sept 2020 than we did in December 2019, and to compare them equally would be misleading. Only by having hundreds of data points would we feel comfortable making strong conclusions based on our data.
Summary
As stated above, we can only speculate as to reasonings behind the trends we are seeing. It looks like the real estate market has trended more positively than expected given the circumstances. People are searching for and finding value in our services, just as much as ever. Lead costs are roughly at the same point as pre-Covid levels, but for different reasons. There is still less competition than before, driving prices down, but also less homeowners converting into leads, which drives prices up.
One factor that we do not have data is on the leads per deal ratio. If there truly is less competition than before, we would expect investors to be turning a higher percentage of leads into deals. This ultimately, can affect ROI just as much as any of the metrics we have covered today.
Overall, we think that the early days of Covid-19 polarized our industry. Where tons of investors dropped out, leading to more profits for existing investors, but less investors in the market overall. The trend we have seen throughout the last 6 months is toward pre-covid levels with competition coming back. We also think that once there is more certainty with regulations and the election, there will be an influx of seller leads that have been waiting in the wings.